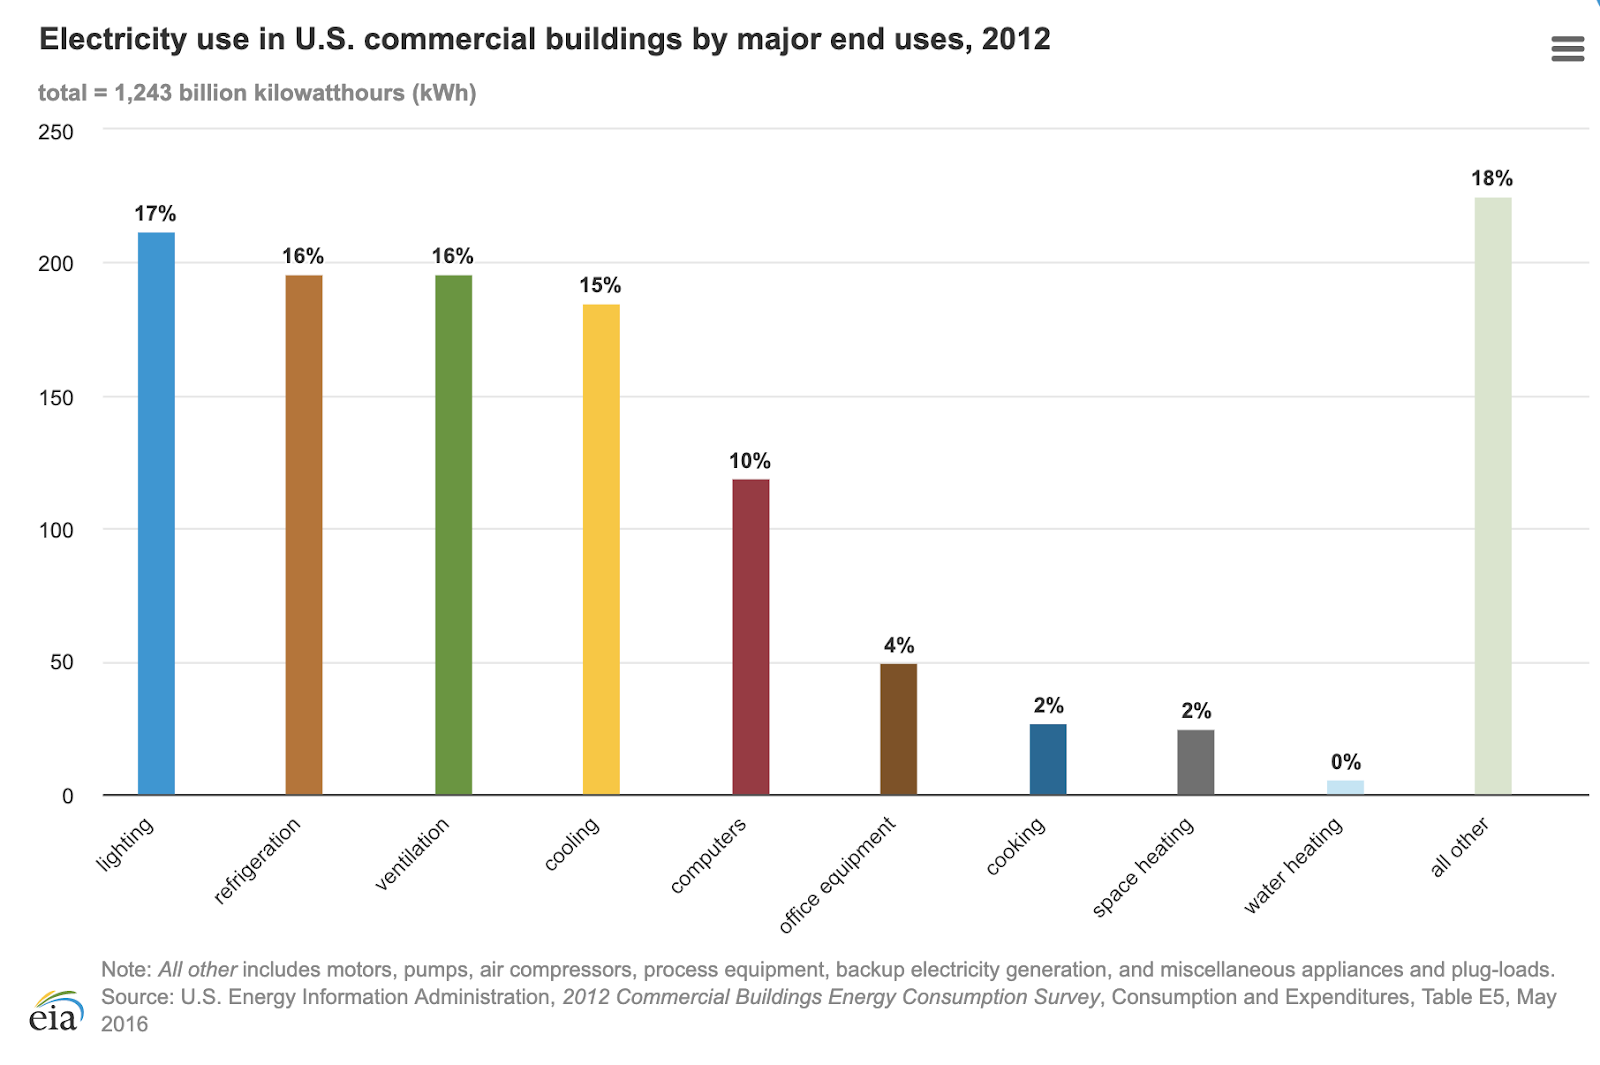
Building electrification is central to rapid decarbonization (Building Decarbonization Coalition 2019). According to the U.S. Energy Information Agency (EIA), lighting, refrigeration, ventilation, and cooling are the predominant electrified end-uses for U.S. buildings. New technologies present opportunities to increase the efficiency of historically electrified end-uses and convert other services to electricity (e.g., space and water heating).
Figure 1. Typical electricity use in U.S. commercial buildings (CBECS 2012).
The average values presented by EIA mask significant variation across climate zones and property types. Here we explore this variation using two complementary data sets: (1) building prototypes from the Pacific Northwest National Laboratory (PNNL) and (2) LEED-certified projects in Arc. Our objective is to understand variation in electricity use as a foundation for tracking changes in electrification over time.
1. PNNL Prototypes
The PNNL building prototype models are typically used for energy code development and evaluation. Energy models using the PNNL prototypes provide estimates of building energy use based on weather data for a representative city in each ASHRAE climate zone. Building types include hospitals, strip malls, offices, and hotels. For existing buildings constructed after 1980, we calculated Electricity Scores for each PNNL prototype. This is a new metric available as part of the Arc Climate Risk module.
The Electricity Score is defined as the ratio of electricity use to total end-use energy multiplied by 100. For example, if a building used 10 kWh of electricity and 40 kWh of natural gas, its ratio of electricity to total energy use would be 0.20, so the electricity score would be 20.
The variation in Electricity Score in each climate zone is due to the differences in total energy demand and energy end-uses (e.g., heating, cooling) across different building types. For instance, a medium office and quick service restaurant in climate zone 4C have scores of 98 (i.e., 98% of energy demand is met with electricity) and 45 (i.e., 45% of energy demand is met with electricity), respectively. The energy demand from offices is primarily from lighting whereas quick service restaurants spend a greater fraction of end-use energy on cooking activities. These types of differences create a wide range of electricity scores for each climate zone.
Figure 2. Variation in Electricity Score by climate zone for the Post-1980 Building PNNL prototype across all building types.
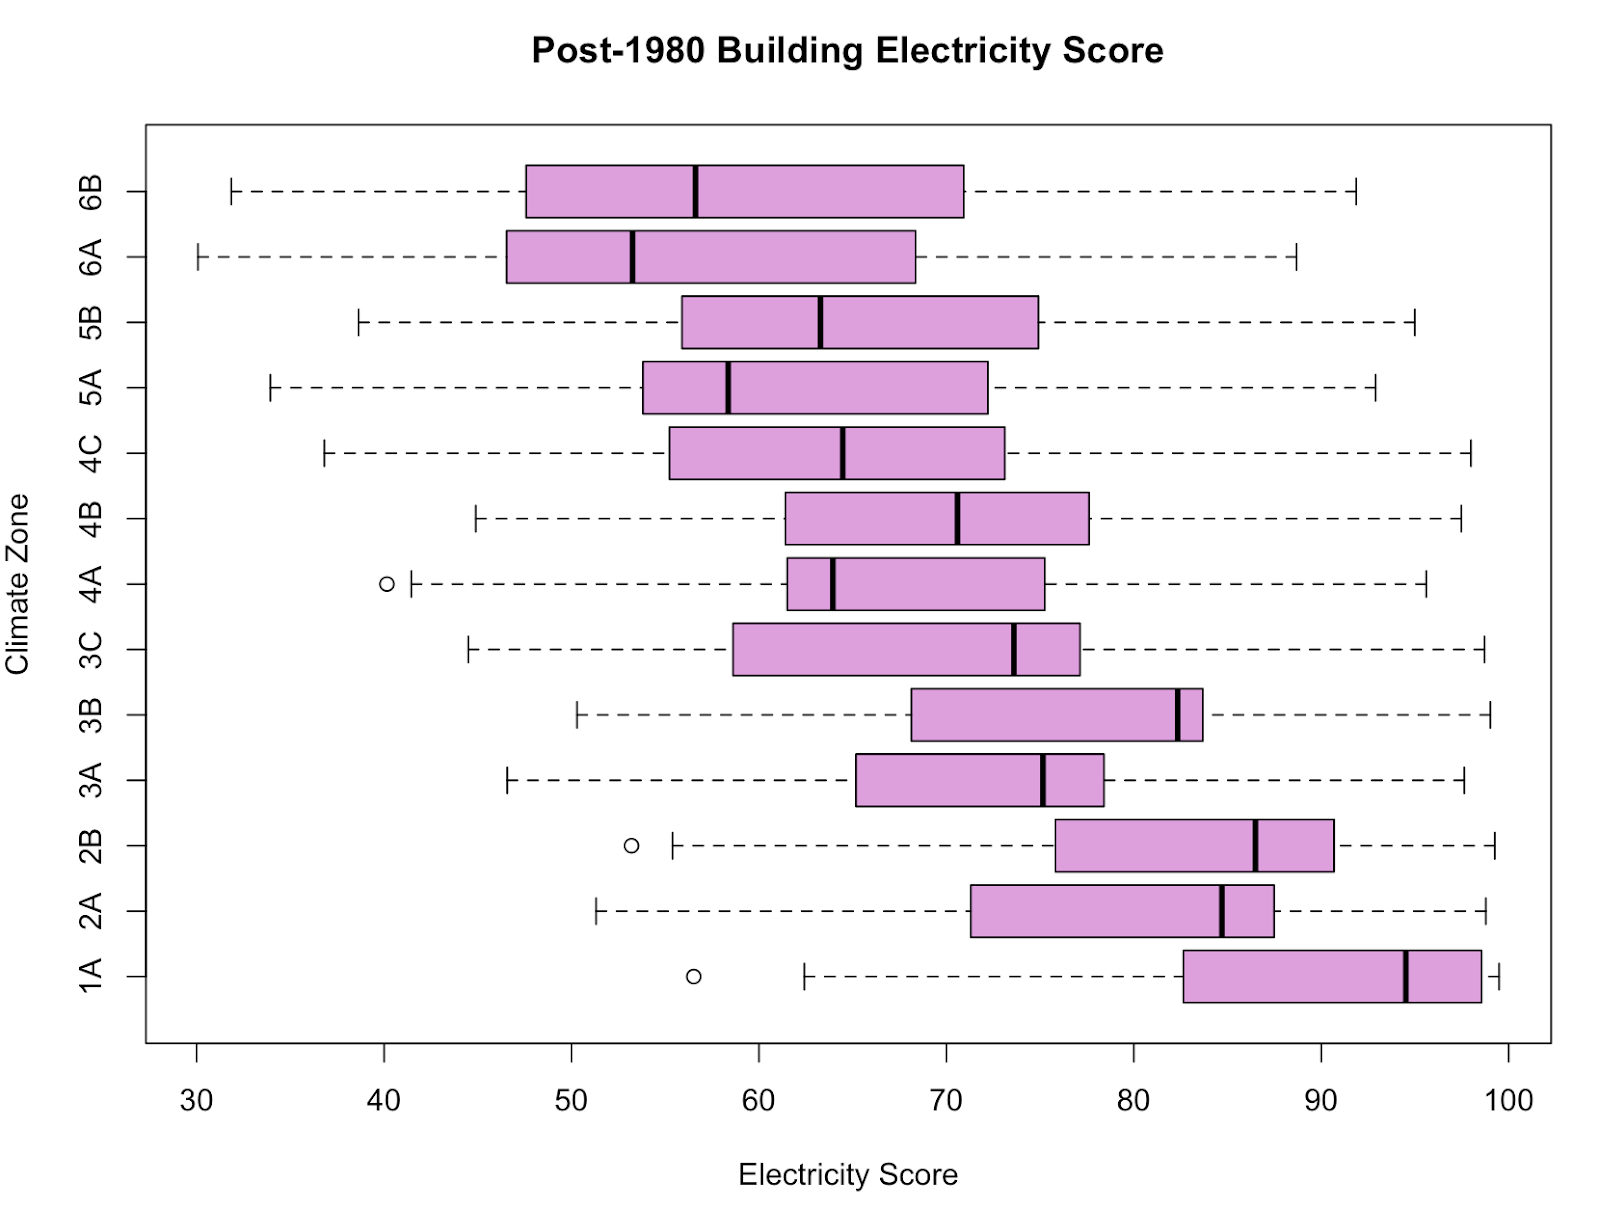
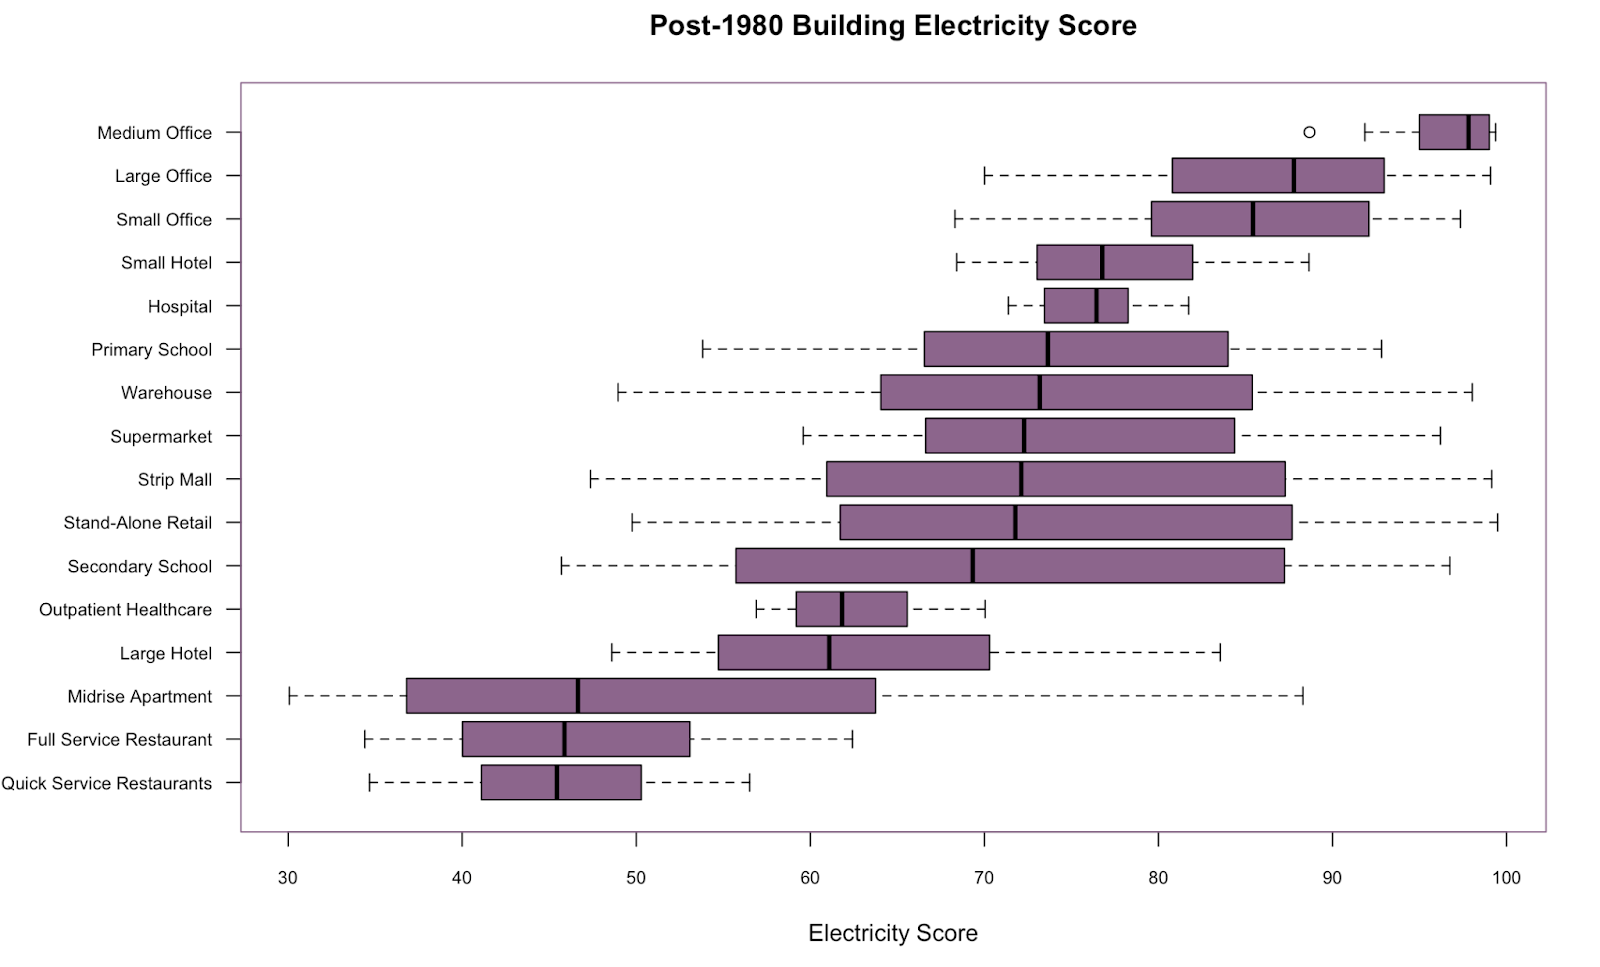
Figure 3. Variation in Electricity Score by property type.
2. LEED Project Data
Arc tracks the operational performance of thousands of LEED-certified buildings across the United States. For this analysis, 496 projects consisting of offices, mid-rise apartments, hotels, and warehouses were categorized by climate zone as defined in the International Energy Conservation Code.
Lower numbered climate zones are generally in warmer areas, corresponding to more demand for electricity-powered air conditioning and dehumidification. Higher numbered climate zones, on the other hand, are in the colder regions with higher heating loads, typically met with other fuels (e.g., natural gas, propane, heating oil, etc.). These buildings spanned all climate zones except for zones 7 and 8 which pertain to areas of Alaska. As shown in the figure below, all of the nine certified buildings in climate zone 1A were 100% electric. Median scores are generally higher in warmer regions, e.g., 1A, 2B, and 3A. Scores in colder climate zones show higher variance, possible due to the greater variation in heating and cooling methods.
Figure 4. Electricity Scores for Arc projects by PNNL Climate Zones in comparison to median PNNL Electricity Scores. Note warmer, more humid Climate Zones have a higher fraction of energy from electricity. On average, colder zones, e.g., Alaska, have lower Electricity Scores, corresponding to increased use of non-electric energy sources. The dark vertical bar is the medium for Arc buildings in each zone.
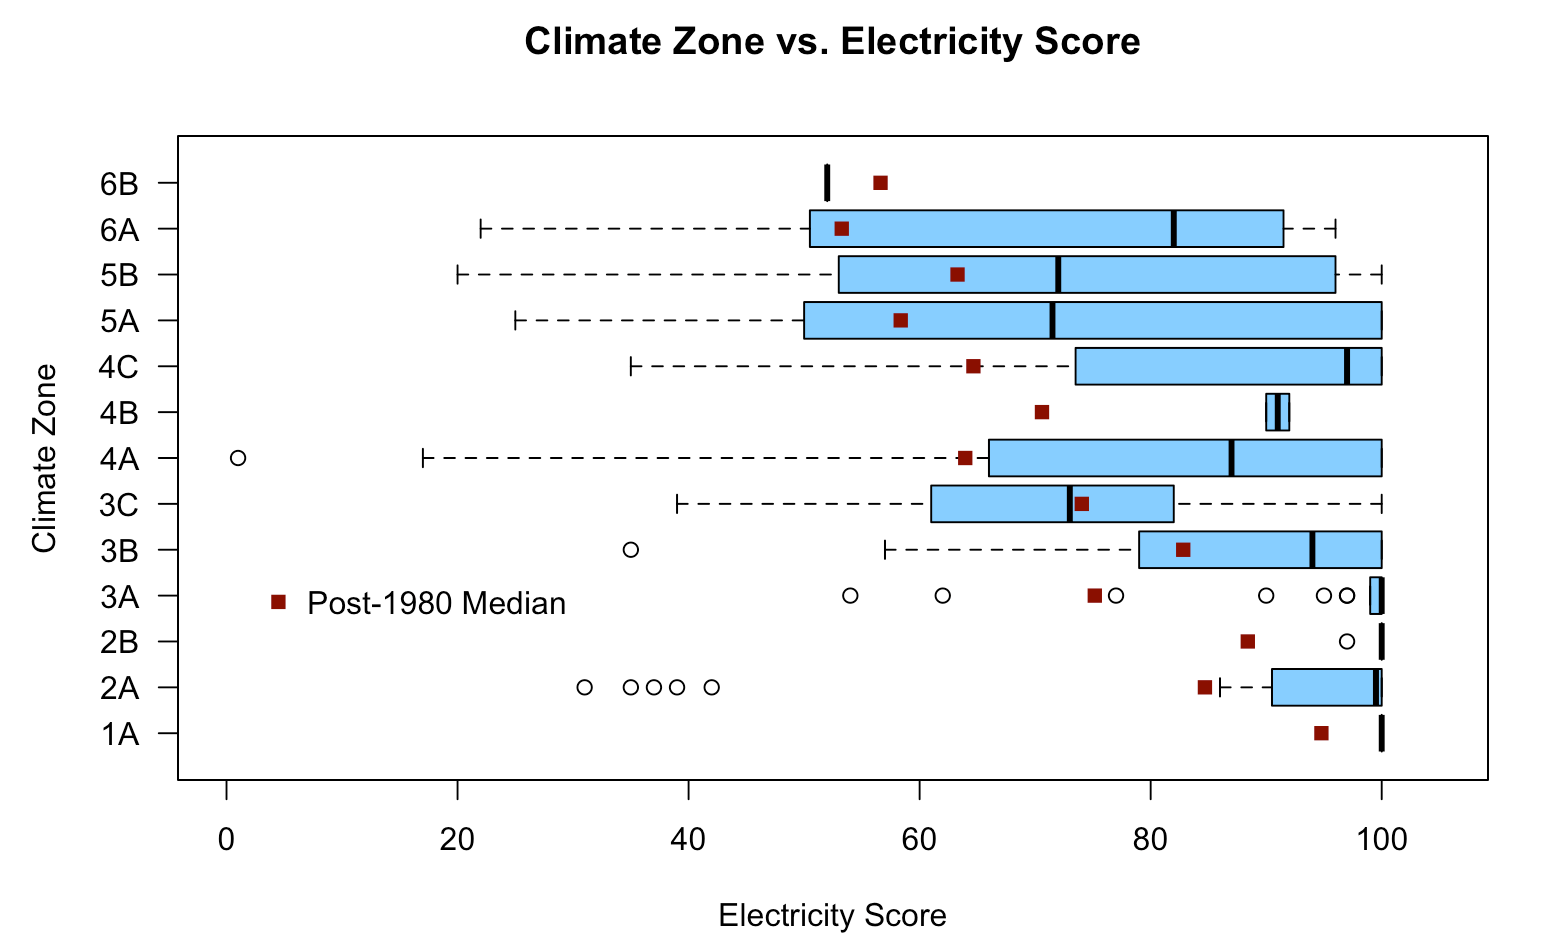
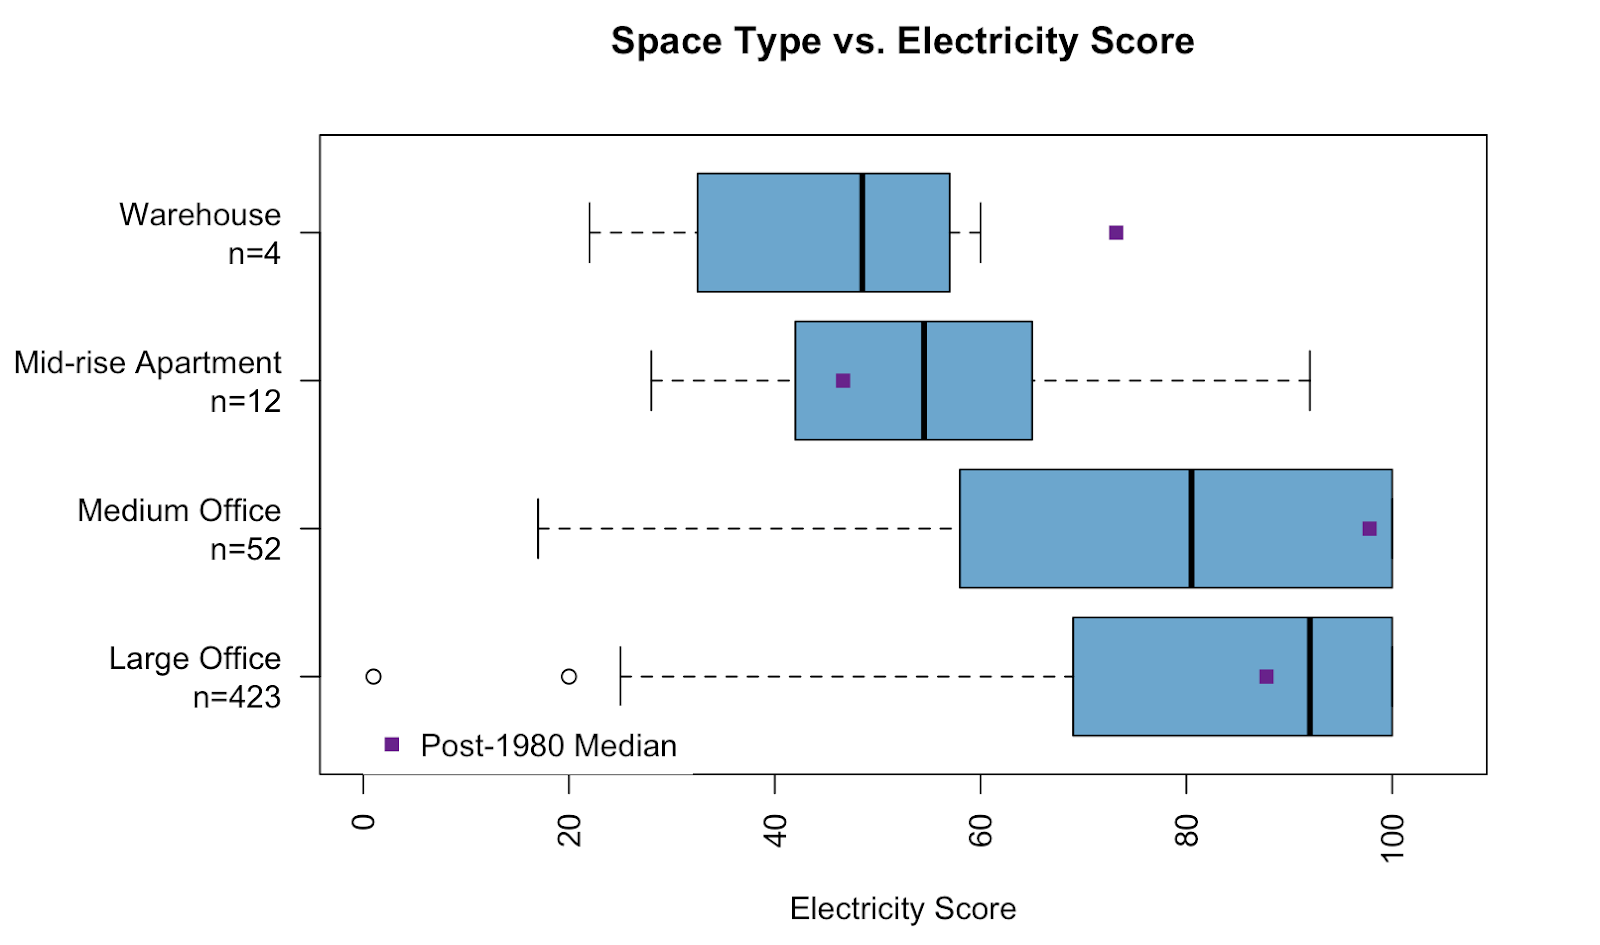
Figure 5. Arc Electricity Score by property type. The purple mark indicates the median for PNNL prototypes across climate zones. This is a preliminary snapshot based on a small sample size for each property type.
Conclusion
Increasing electrification is an important component of economy-wide decarbonization. The data presented here illustrate the electricity use varies systematically by climate zones and property type. This means that these factors will need to be considered when measuring and scoring progress in building electrification.