
Feature image: The LEED-certified 303 Second Street property in San Francisco uses Arc. Photo credit: Lawrence Anderson Photography, Inc.
Arc’s philosophy centers on the premise that data is one of the key pillars of sustainability. By understanding the performance of buildings and their environmental impact through comprehensive data collection and analysis, stakeholders can identify areas for improvement, set goals and measure their progress.
Arc empowers building owners, operators and managers to not only upload, track and score performance, but also to identify areas of improvement while recognizing projects ready for recognition. Equipped with actionable key performance indicators (KPIs), users are driven to make informed decisions to reduce their carbon footprint and create greener, more sustainable spaces.
Case study: The United States
The U.S. has been actively engaged in sustainability efforts around the world, setting ambitious goals to have 100% carbon pollution–free electricity by 2035 and a net zero economy by 2050. This same commitment to sustainability can be found within the green building space. In the U.S. alone, over 14,000 projects have been registered on the platform by over 6,000 users, with about 900 projects added by mid-2023. The states with the most projects are California, Texas and New York.
From these projects, Arc is tracking over 71 million metric tons of CO2e, 282.8 billion gallons of potable water, 4.1 billion pounds of waste generated and 1.7 billion pounds of waste diverted.
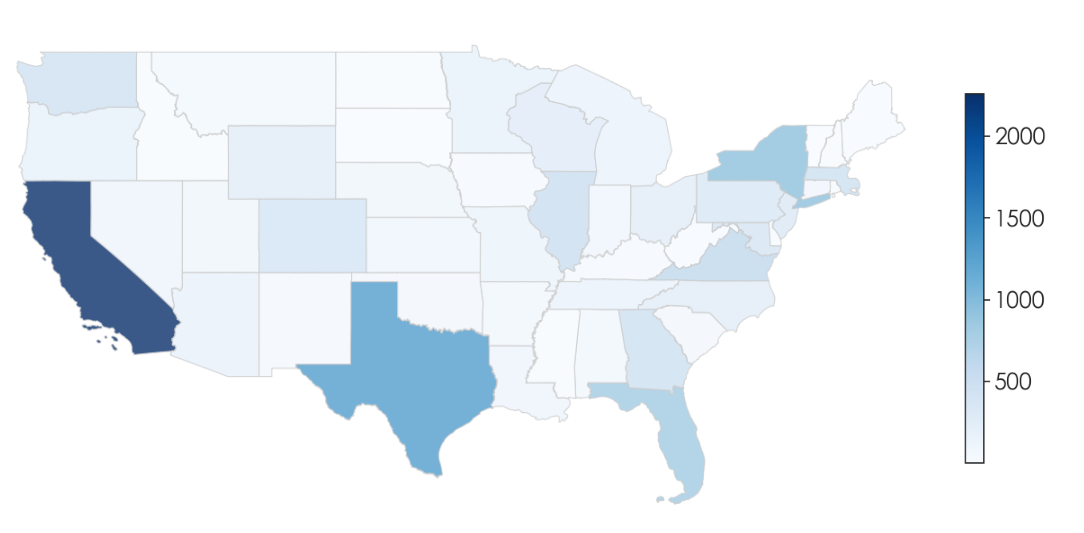
Figure 1. Map of projects in the United States and the highest number of projects in California (2,428), Texas (1,398) and New York (1,006).
Project impact with LEED certification
As Arc provides a holistic, data-driven approach to measure building performance, projects on the platform are well prepared to undergo the LEED certification process. Arc users can track both their performance score based on energy, water, waste, transportation and human experience and their points-based progress toward LEED certification. On a portfolio level, users can compare assets’ performances side by side to prioritize projects for certification or improvement by category.
Currently, 34% of Arc projects in the U.S. have some degree of LEED certification. This leaves 66% of U.S. projects using Arc for a variety of reasons such as portfolio tracking, carbon tracking, performance management, facility education, or other framework and standard alignment.
LEED-certified projects, on average, demonstrate better performance than their uncertified counterparts, with performance increasing by certification level. To obtain more LEED points toward higher levels of certification, higher levels of performance from buildings are required. This is illustrated with performance data on greenhouse gas (GHG) emissions intensity and water use intensity by certification below. Sample sizes within each figure are based on data availability as of July 2023. These sizes represent the number of projects with up-to-date potable water and energy usage.
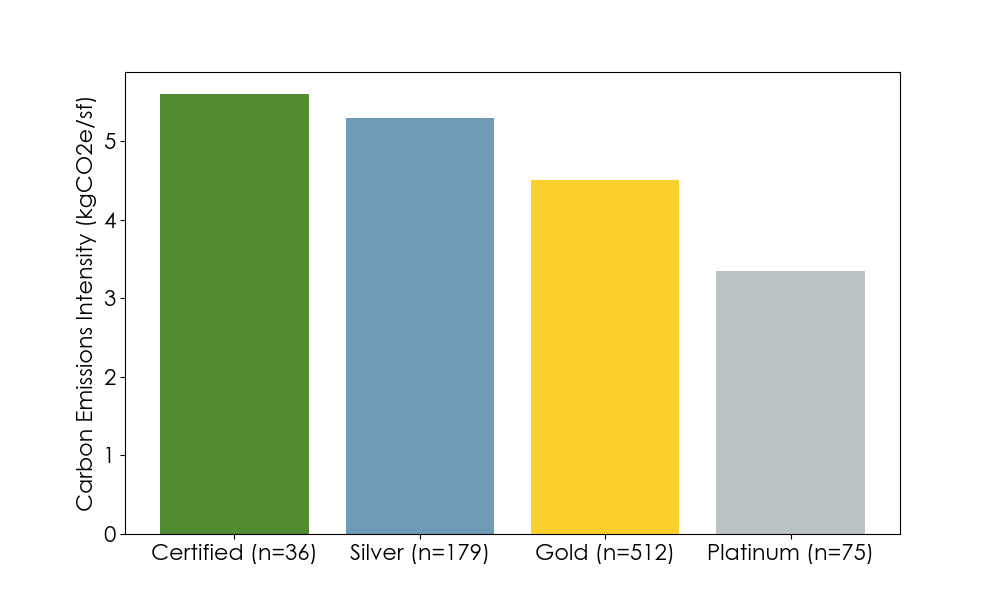
Figure 2. Median GHG emissions intensity by certification level for U.S. projects (July 2023).
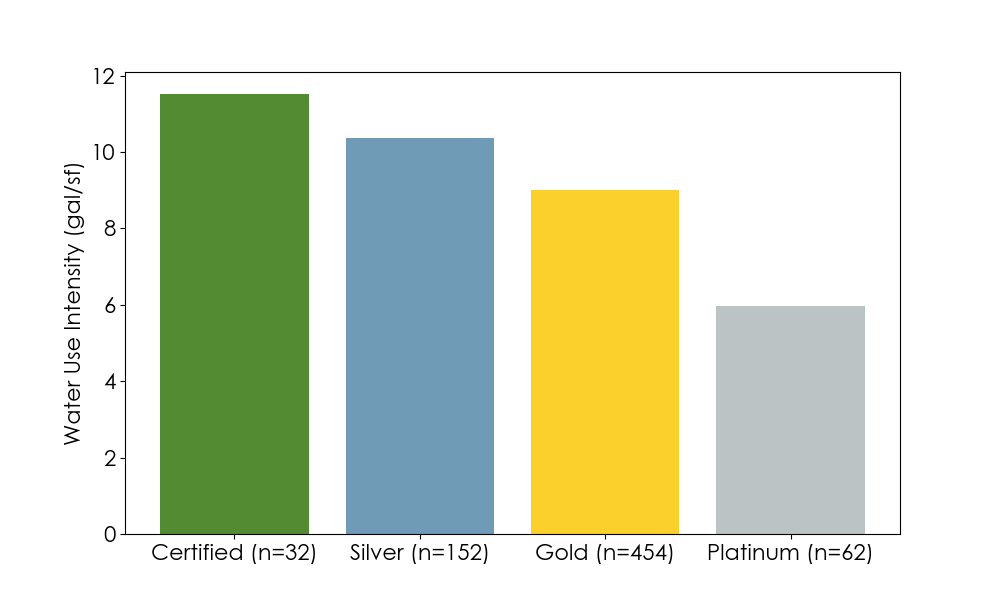
Figure 3. Median water use intensity by certification level for U.S. projects (July 2023).
These figures demonstrate the clear reduction in negative impacts when higher certification is achieved. Using Arc, building professionals can monitor the sustainability metrics of projects and portfolios over the course of their lifetimes. Equipped with insightful dashboards and analytics, stakeholders can assess their performance continually and make progress toward LEED certification and sustainability goals.
For more information on Arc and to see more statistics on all Arc-hosted projects, visit our impact page.