
Motivation
There are many kinds of leadership. Arc will recognize them with many different scores.
The Arc Performance Score uses operational data to provide a measure of leadership with respect to a global sample of green buildings -- something Arc calls the “reference set”. This means that a high Arc Performance Score corresponds to an overall level of performance comparable to the best green buildings around the world. Conversely, a low score means that a project performs below the level achieved by other projects with comparable size, schedule, and occupancy. The Arc Performance Score is based on an ongoing 12-month performance period. The Score reflects only the measured performance during that period.
There are other forms of leadership. For example, we can recognize leadership through improvement. In this case, we are not interested in the absolute level of performance, rather we are looking for the change between two time periods. We know that reducing energy use in a building by 25% is a major achievement, even if the resulting building ends up only average with respect to its global peers.
The complementary roles of leadership among peers (Arc Performance Score) and leadership through improvement (Arc Improvement Score) is a common part of everyday experience. Every swim club or track team recognizes the very best athletes and those who have made the greatest gains during a season. We give ribbons and trophies to both; of course, with clear distinctions between them.
This distinction has been difficult for the green building community to make. Historically, we have been comfortable recognizing the so-called high performers, such as projects achieving zero net energy operations or exceptionally high ENERGY STAR scores. However, as a community, we have been less comfortable describing improvement as leadership. This needs to change. Every space and every building can improve, and those projects achieving significant levels of improvement are leaders.
These factors motivated the development of the new Arc Improvement Score. A new tool to recognize leadership in operational performance as measured through year-over-year change. The new Arc Improvement Score is not yet tied to LEED, and it cannot (yet) be used for certification. However, we are releasing the new score at this time to gain experience and improve its calculation and application.
Approach
Arc attempts to calculate an Improvement Score for every project. This is in addition to the existing Arc Performance Score. This means that every project has multiple scores and the potential for recognition for different types of leadership.
Calculating an Arc Improvement Score requires 2-years of operational performance data. This is divided between a 1 year baseline period and a 1 year performance period. By default, the performance period is the most recent 12 months and the baseline period is the 12 months preceding that. If a longer record is available, users will have the option to select a specific baseline and performance period. These periods may not overlap.
In its initial form, the Improvement Score is a measure of change in intensity between the baseline and the performance period. The calculation does not include any normalization, such as weather. This normalization was omitted, because the purpose of the score is not to evaluate the effectiveness of mean or practice. Rather, the Improvement Score is initially intended as a simple metric of change over time. We welcome ideas and feedback on this first iteration of the Improvement Score.
In this release, Arc Improvement Scores are provided for each performance category. They are not yet aggregated into an overall Improvement Score.
The Arc Improvement Score calculation is made in two parts: First, the percentage change between the baseline and performance periods is calculated, typically as a change in intensity. Then, the percentage improvement for each performance category is translated into an Improvement Score through a scoring function.
The following section describes the percentage change calculations. The next second describes how percentage changes are converted into scores.
Part #1: Calculating Change
Change in Energy Intensity
- Percentage Change in Site Intensity Improvement
- ((site energy/floor area) during performance period) - ((site energy/floor area) during baseline) / ((site energy/floor area) during baseline)
- Percentage Change in Source Energy Intensity
- ((source energy/floor area) performance period) - ((source energy/floor area) baseline) / ((source energy/floor area) baseline)
- Percentage Change in Energy Cost Intensity
- ((cost energy/floor area) performance period) - ((energy cost/floor area) baseline) / ((energy cost/floor area) baseline)
Change in Water Use Intensity
- Percentage in Water Use Intensity Improvement
- ((total water use performance period/floor area) during the performance period) - ((total water baseline/floor area) during the baseline period) / ((total water baseline/floor area) during the baseline period)
Change in Waste Intensity
- Percentage in Water Generation Intensity Improvement
- (weight waste generation/occupant performance period) - (weight waste generation/occupant baseline) / (weight waste generation/occupant baseline)
- Percentage Waste Diversion Intensity Improvement
- ((waste diversion/occupant) during performance period) - ((waste diversion/occupant during baseline period) / ((waste generation/occupant baseline) during the baseline period)
Change in Transportation Carbon Intensity
- Percentage Change in Commute Carbon Intensity
- (average one-way commute GHG emissions during performance period) - (average one-way commute GHG emissions during the baseline period) / (average one-way commute GHG emissions during the baseline baseline)
Change in Human Experience
- Percentage Change in Occupant Satisfaction
- (average satisfaction during performance period) - (average satisfaction during baseline period) / (average satisfaction during baseline period)
Part #2: Calculating the Arc Improvement Score
Each percentage improvement is then converted into an Improvement Score. This provides a measure of the degree of leadership reflected by the improvement (i.e., how good is the improvement, in this case, relative to other property companies). In this initial release, the critical points in the scoring function are generalized from results from the 2018 GRESB Real Estate Assessment.
There are three critical points in the scoring function:
- 100: An Improvement Score of 100 is given for change ≥35% between the baseline and performance period. This reflects the best year-over-year change observed for any GRESB reporting entity.
- 40: An Improvement Score of 40 is given for 5% year-over-year change. This reflects the average improvement for entities recognized as GRESB Green Stars.
- 0: An Improvement Score of 0 is given for ≤2% year-over-year change. This reflects the average improvement of the entire GRESB universe (all reporting property companies and funds).
Figure 1. The scoring function below illustrates the relationship between the percentage change between the performance period and the baseline and the Improvement Score.
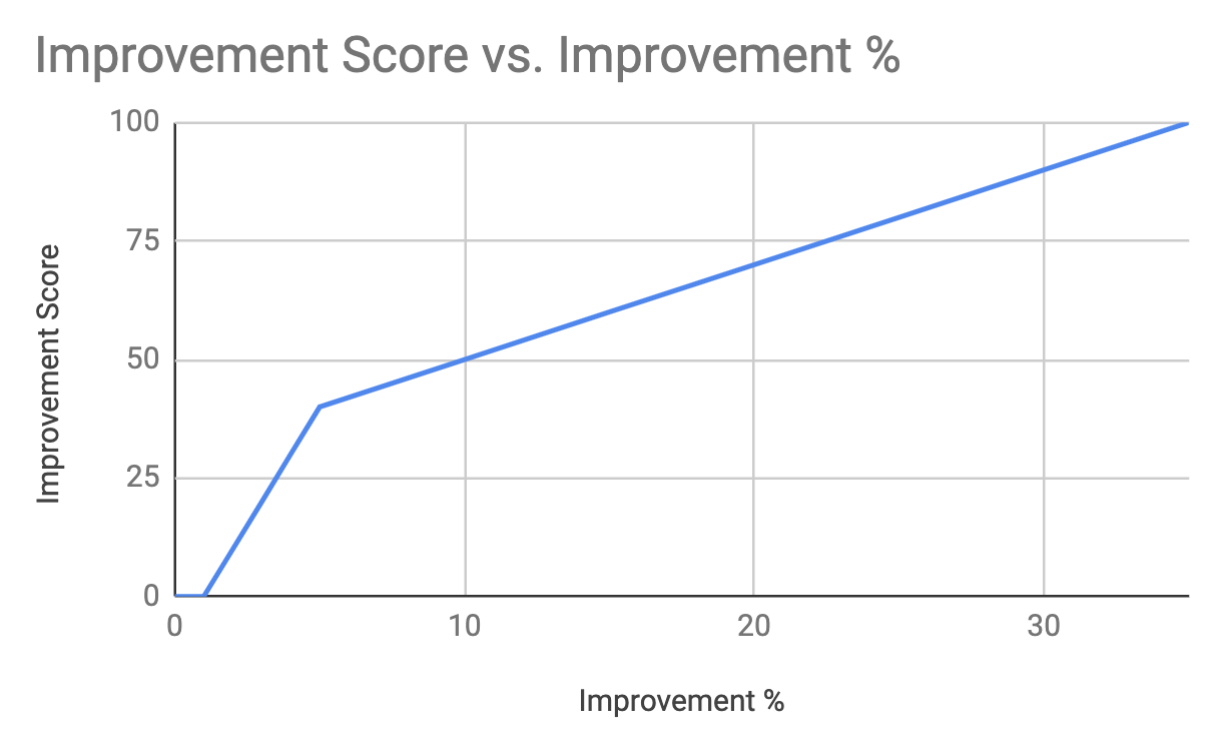
In other words, an Improvement Score of 100 reflects an exceptional level of improvement relative to the 1,000 companies and funds responding to GRESB in 2018. An Improvement Score of 40 reflects the average of market leaders (a.k.a., Green Stars). An Improvement Score of 0 reflects essentially business-as-usual change year-over-year. There are many other possible relationships. These critical points provide a starting point to explore the characteristics and utility of this measure of leadership. We are very interested in feedback about these choices and potential additions or alternatives.
Note that an Improvement Score of 0 does not mean that the project is not a leader in other dimensions. It is entirely possible that exceptionally high scoring projects will not be able to achieve large improvements in year-over-year performance. These projects should be recognized with high Arc Performance Scores.
Applications
The new Arc Improvement Score is intended to provide a new way to explore, analyze, and compare project performance. The calculation and score methods is open for discussion and evaluation. We expect it to evolve and improve with user feedback. We hope that a future version of the Arc Improvement Score may provide a useful way to recognize different kinds of leadership and maybe provide a new pathway to LEED certification.
Please contact The Arc Team with questions or comments about the Arc Improvement Score.